
The CLARiTY Advantage
No light escapes as scatter. The accurate absorbance is the only answer possible.
A Powerful New Generation of Measurements where filtration, centrifugation, numerical correction, and other time and consumable-intensive sample clarification are entirely up to
you, not the spectrophotometer.
The CLARiTY is equally successful with clear, turbid, hazy, frozen …

“It works! It really works!” Over and over again, we said these words ourselves. And we still smile as you say the same. But, since developing the integrating cavity technology in the 2010s, we have witnessed applications spanning materials, prokaryotes, eukaryotes, to beer and wines move into a new generation of easy, quick, correct absorbance measurements with savings in time, consumables, and frustration.
Nothing stops you from working with clear solutions. But, if you are ready to see what your molecules look like in a more complex environment, you are ready for a CLARiTY.
Limitations of Cuvettes
The measurement light from the spectrophotometer passes through a small section of the cuvette, so that:
(1) the sample volume must be to at least this Z-axis level, and
(2) only the portion of the sample through which the light passes is involved in the measurement and thus in the experimental results.
A third limitation is that the sample must be perfectly clear. The more hazy the sample, the more flawed the results. Cuvette spectrophotometers lose some to most of the photons to “scatter.”


ADVANTAGES OF THE INTEGRATING CAVITY

CLARiTY spectrophotometers are entirely successful with all light absorbing samples. Scatter does not matter.
Recall: Cuvette spectrophotometers can only get accurate results on clear samples. Scatter by the sample ruins the answer by a little to completely.
Our 'magic' involves use of an integrating cavity, a quartz chamber entirely sealed within the highest reflective material available. Scatter becomes irrelevant, because it is not lost but remains part of light captured by the detector.
Your sample can be any level of clear or hazy or turbid...the light stays within the cavity, reflecting off the white reflective walls until the photons are either absorbed or exit to the detector.
Your UV/Vis results are accurate on every sample.
A second benefit of the integrating cavity is its versatility. The most popular cavity volume is 8 mL with an associated effective pathlength of < 30 cm, but you can also choose to use a partially filled cavity, samples within test tubes, and solid samples immobilized and immersed in the measurement cavity.
A third benefit is that 100% of the sample is involved in the measurement. In a cuvette, only the slim sliver of sample that the light passes through is used.
One Answer in Four Media (clear to opaque)

Results from a cuvette spectrophotometer:
Here, we see one protein concentration in four solvents of increasing turbidity.
The answer changes from accurate to inaccurate to ultimately nonsense in the face of increasing turbidity. The only correct answer is the blue on the far left.
Results from a CLARiTY spectrophotometer:
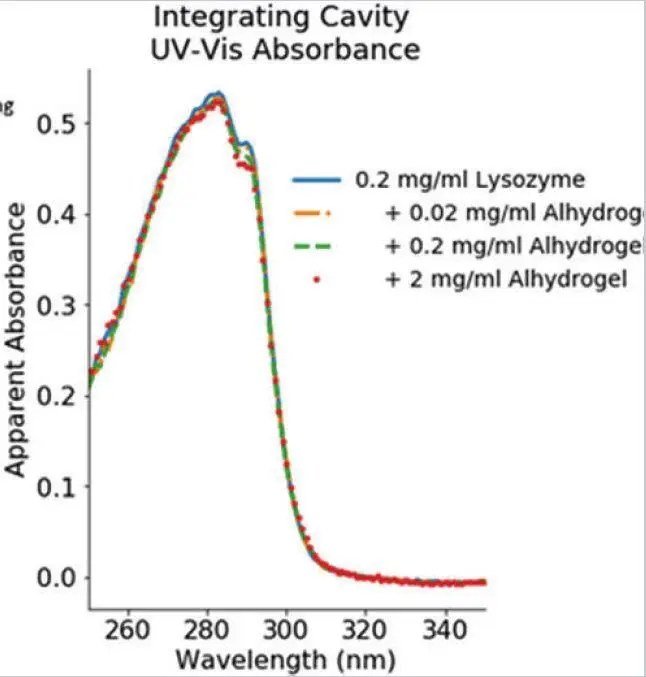
The same four samples were analyzed on a CLARiTY spectrophotometer. These results, published in Analytical Chem, May 2018, confirm that the protein concentration is measured exactly the same whether the protein is measured in a clear or opaque medium. Turbidity does not and in fact cannot change the absorbance. Recall, the problem with turbidity – that it causes light loss or “scatter” – does not occur.
Using whole algae, a good cuvette spectrophotometer gets the characteristic exponential rise (wrong) answer:


The “scatter plot” is a sample of algae with a cuvette spectrometer. Notice the characteristic exponential rise towards the UV and the large abs/ cm values. These data are worthless. You’ll be amazed at what the structure of the algae actually is, next graph.
The ‘plot of algae with CLARiTY” is the same sample (and two others) of algae with our CLARiTY. Notice the Y-axis, the absence of the exponential rise in the UV (< 400 nm), and the beautiful structure. These show the correct answer, even in suspensions of living algae
An Integrating “Cavity” is NOT an integrating “Sphere”!

This graphic was used at an International Food Technology (IFT) meeting and shows the spectrum of whole milk run on a (a) common UV/Vis using a 1 cm2 cuvette, (b) that same UV/Vis fitted with an integrating sphere, and (c) our CLARiTY. Again, notice the extremely high absorbance on the first two and their absence of useful structural information. The Y-axis from the CLARiTY is 0-0.4 A/cm and the structural information is clean and valuable.
Here, the integrating cavity CLARiTY spectrophotometer finds the structure in these algae.

Considering Volume Concentration
More details about the Integrating Cavity

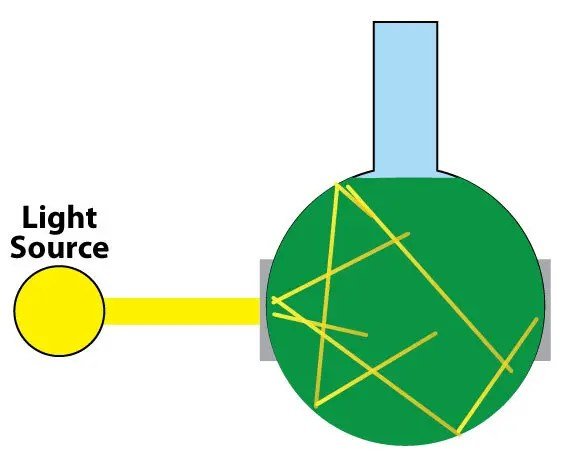
Our favorite shape is round, but an integrating cavity can take other forms.
A round-bottom quartz flask was our first design. Round is the perfect shape. And, it leaves the sample nowhere to hide. The flask is blown of high quality quartz, inert to effectively every sample and cleaning agent.
The most popular volume is 8 mL. Example sample preparations are (a) 50 uL of protein in 8 mL of solvent, (b) 10^7 cells/ mL of living cells or bacteria, and (c) a test tube containing 2 mL of nanoparticles.
Highest sensitivity is achieved when the cavity is filled with the sample. As is illustrated above, the sample can also be:
• A very small or partial volume in the flask
• A lesser volume introduced within a 2 mL test tube
• A solid lowered or coiled into the flask
• An immobilized solid within a solvent bath
Absorbance and Pathlength

Low absorbance = Longer pathlength
The standard volume cavity is 8 mL. With a low absorbance sample, the resulting pathlength is 30 cm. Sensitivity is on the nanomolar range.
Absorbances from roughly 0.001 AU/cm to 3 AU/cm are successful in the filled cavity.
Higher absorbance = Shorter pathlength
Higher absorbing samples will cause a shorter effective pathlength in the same volume as a low absorbing sample.
Flow-through Cell Options

Since very high absorbance samples are best measured in very short pathlength integrating cavities, use of flow-through cells is practical. Such samples include undiluted whole milk, red wine, and highly colored flowable ingredients. With these very short pathlength integrating cavities, absorbances from 3 to 100 AU/cm can be made.
Five pathlengths now offered are:
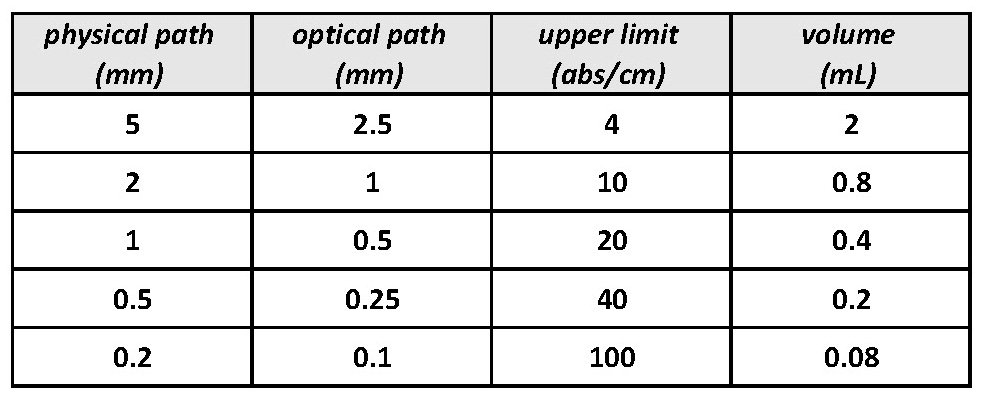
OLS pathlength chart
The Integrating Cavity is within the DSPC

The integrating cavity is permanently packed inside a housing, which we call a DSPC, for DeSa Suspension Presentation Chamber.
Between the quartz integrating cavity and the high density black housing is a highly reflective material, encasing the integrating cavity and its contents.
The light inside the cavity reflects endlessly off this reflective surface until it is either absorbed by the sample or exits the DSPC to the detector.

Quartz rods -- straight or curved, short or long – can be used to direct light in and out of the DSPC.

A lab might have two or three DSPCs to accommodate different sample types. These sample holders are extremely easy to exchange one for the other. Stirring and Peltier control are available.
The "gas of photons" inside the DSPC

The measurement light is fully diffused as a “gas of photons.”
All photons are trapped within DSPC until they pass through a port to the awaiting detector.
Roughly 5% of the light in escapes as detected light.
Roughly 0.1% of the light is absorbed by the reflective surface.
How can OLIS help you achieve CLARiTY?
Expand your opportunities, reduce waste, be in control. Using better technology brings all this. Start the conversation now!

An integrating cavity can be thought of as a filled integrating sphere. It was the 1950s when group of oceanographers gave this idea a try. Their goal was to achieve a very long pathlength and thus very high sensitivity.