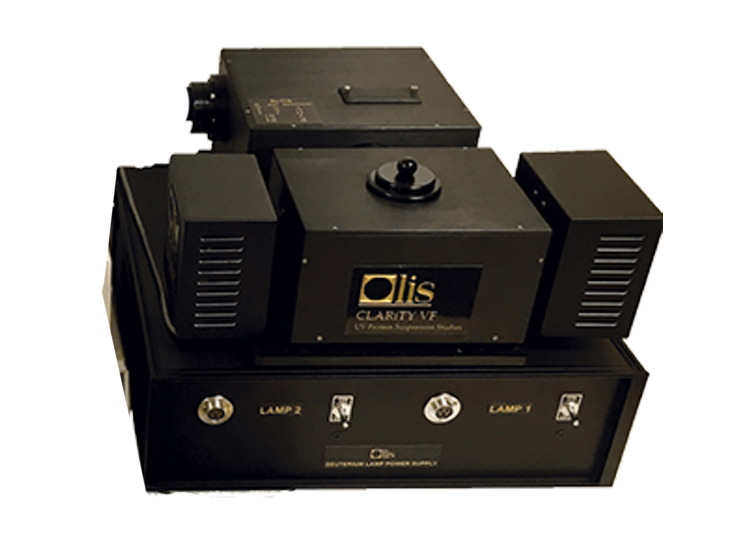
OLIS CLARiTY VF
"The OLIS CLARiTY is a specialized spectrophotometer that takes absorbance measurements in the UV-visible range in turbid solutions, allowing for measurements on intact cells under physiological conditions."*
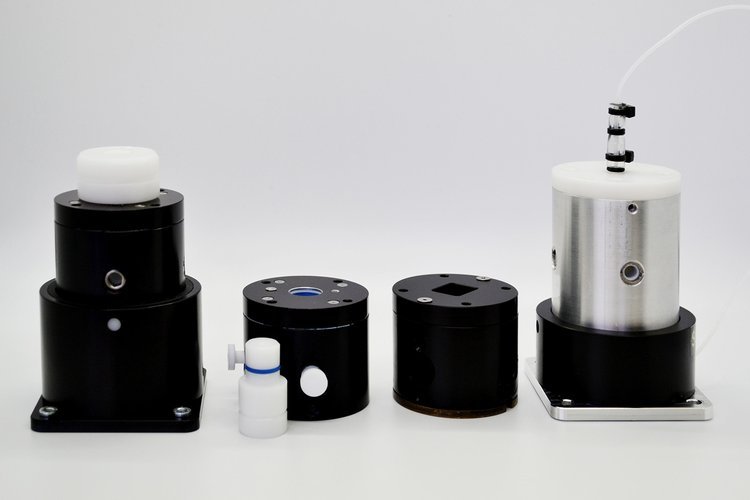
The smallest CLARiTY, this unit can be factory configured for scanning absorbance or scanning emission. The light source can be a tungsten, deuterium, or LED, based on intensity and spectral range needs. Configure your CLARiTY VF to study the electron transport region (absorbance, 400-600 nm), protein studies (240-400 nm), pump-probe or fluorescence (wavelength specific LEDs).
Standard Model Performance
Absorbance or Fluorescence
Download Specifications
Upcycle from Standard
Phosphorescence Lifetime
Accessories
Why Choose the OLIS CLARiTY VF?

#1
You want CLARiTY performance at a cuvette spectrophotometer's price point

#2
Your application involves either scanning absorbance or scanning emission; you don't require monochromators before and after the sample

#3
You need a smaller instrument with outsized performance
Ask for a price quote today!
The Short
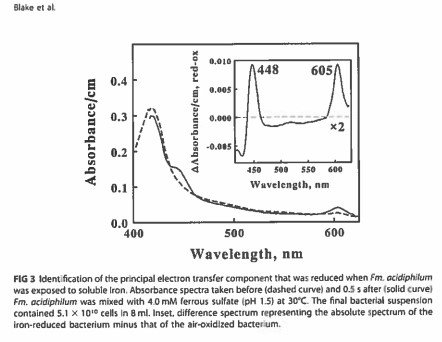
A single page piece, circa 2014, on using CLARiTY to follow metabolism in the electron transport chain:
“Today, research using a new integrating cavity spectrometer has demonstrated that isolated cell components do not act the same as when those components are in their native environment … when they are not in the environment in which they were designed to function, they may behave differently.”

The Long
A 16 page chapter, circa 2020, on using CLARiTY:
“One thing is certain: one way to understand how a protein functions in an intact organism is to actually observe that protein as it functions in the intact organism. This paper provides an example of just such an observation.”
The Short and Long of It.
Setting the new benchmark of performance.
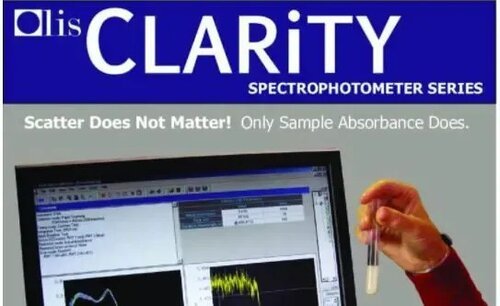
For decades, spectrophotometrically working with turbid suspensions has proved elusive, because the measurement beam is scattered in all directions; only a fraction of it passes through the sample to the detector. “Apparent high absorbance” is the result, as these examples show.
Results from four popular and respected spectrophotometers compared with the Olis CLARiTY 1000

The sample was the most concentrated suspension of polystyrene particles in water (about 108 of the 1 micron particles/mL H2 O) as shown on page 2. Recall, polystyrene particles do not absorb light, so the correct answer is 0.0 AU. The ubiquitous HP/ Agilent diode array spectrometer returns an answer that is more than 1.1 AU.
The world-class dual beam, double monochromator based Cary 14 collected a maximum absorbance near 0.7 AU. As expected, better results were obtained from the “dual wavelength” spectrophotometer which was developed by Britton Chance expressly for the purpose of studying turbid samples.
In its split beam mode, the DW-2 reports absorbance of 0.5 AU and in its dual wavelength mode, an impressive <0.2 AU. Understandably, this dual wavelength model has held the honor as the “gold standard” of performance on turbid suspensions since the 1960s.
The CLARiTY, however, gets zero absorbance, give or take 0.01 AU.
And, as these and other data will show, scatter does not matter to the CLARiTY, including the UV, where even the “gold standard” cannot handle the scatter correctly.
Not sure if you should choose a diode array, CCD, or scanning spectrophotometer?
Reading this may help.

The CLARiTY Advantage
Integrating Cavity Spectrophotometers For a Powerful New Generation of Measurements
Everyone knows about spectrophotometers that use cuvettes. With cuvette spectrophotometers, accurate results are possible only with perfectly clear samples. When the sample is hazy or turbid, the light beam carrying the absorbance information is scattered, much of it away from the detector. The answer is therefore higher absorbance than is correct. Read more...
OLIS VF Resources

Illustrative Experiments with CLARiTY: Check out some of the amazing experiments researchers have done with CLARiTY instruments. What will you do?


*Dynamic regulation of NADPH oxidase 5 by intracellular heme levels and cellular chaperones
Elizabeth A. Sweeny, Simon Schlanger, Dennis J. Stuehr
Department of Inflammation and Immunity, Lerner Research Institute, The Cleveland Clinic, Cleveland, OH, 44195, USA
CLARiTY brochure.
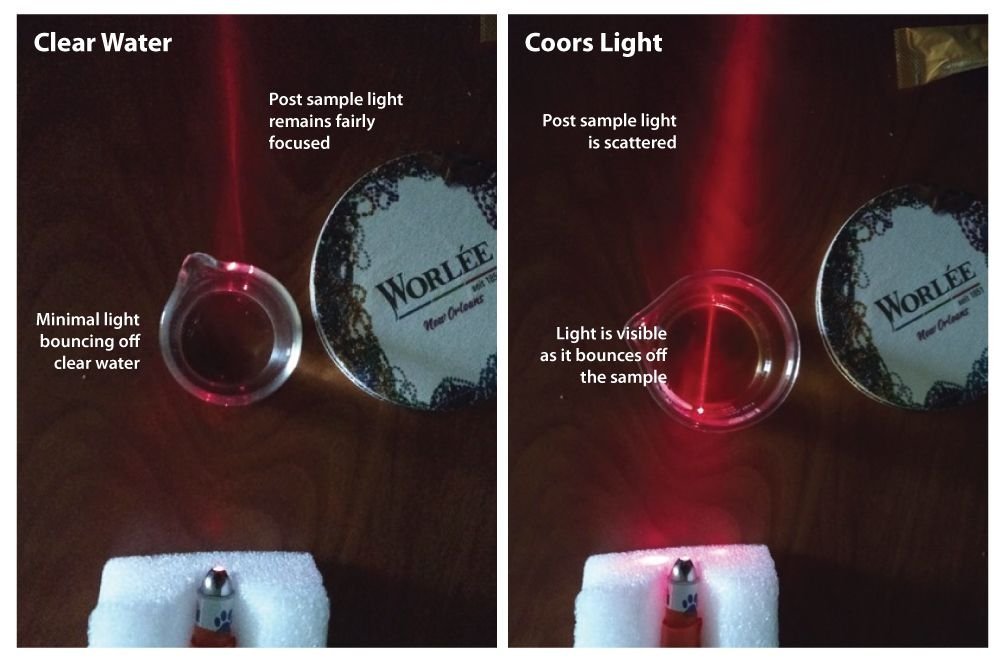
Is your sample as clear as you think it is?: With this very simple illustration, we show that “clear” to the eye is not necessary “clear.”
Inside the Integrating Cavity: An integrating cavity can be thought of as a filled integrating sphere, but with considerable advantages.
Can one determine absorption (extinction) coefficients using the CLARiTY?